


INTRODUCTION
The amnestic form of mild cognitive impairment (aMCI) is regarded as a prodromal state of Alzheimer’s disease (AD) dementia [1]. According to the results of neuropsychological tests, aMCI can be classified in several ways: single-domain vs. multi-domain, verbal memory- versus visual memory-predominant, and early vs. late [2-4]. In addition to the patterns found in the neuropsychological test results, aMCI patients show varying degrees of brain atrophy and clinical course. While some patients remain stable or even revert to normal cognition, the annual rate of the conversion to dementia for aMCI patients is up to 20%, which is suggestive of a heterogeneous entity [2,5,6]. Therefore, understanding the clinical course of aMCI and determining the prognostic factors of the conversion to dementia have attracted considerable attention.
Regarding the conversion from aMCI to AD dementia, several studies have reported demographical, radiological, neuropsychological, and laboratory factors predictive of the progression. Poor performance in episodic memory tests, cognitive impairment in other domains such as frontal/executive function, and depression are all known to predict the conversion to dementia in aMCI subjects [7-10]. In fact, even among aMCI subjects, those with more severe memory impairment, multi-domain cognitive deficits, or verbal memory impairment have higher dementia conversion rates than those with milder memory impairment, memory involvement only, or visual memory impairment only [3,11-13]. In addition, the results of a recent meta-analysis showed that older age, female gender, hypertension, diabetes, hippocampal and medial temporal lobe atrophy, entorhinal atrophy, lower mini-mental status examination (MMSE) score, higher Alzheimer’s Disease Assessment Scale-cognitive subscale (ADAS-cog) score, presence of the apolipoprotein E4 (ApoE4) allele, and abnormal cerebrospinal fluid tau levels are associated with the progression from aMCI to AD dementia [14]. Additionally, aMCI patients with positive amyloid positron emission tomography (PET) scans are significantly more likely to convert to dementia than amyloid-negative patients [15].
While the above-mentioned studies have shown differences at the group level, they did not predict the risk of dementia at the individual level. Although group analysis provides perspective in understanding the nature of the disease entity, it is not enough to predict an individual’s risk. Therefore, it is crucial to develop risk prediction models such as nomograms, which are useful for patient counseling, management, risk stratification, and sometimes for the determination of early enrollment in clinical trials [16]. In a recent study by our group, we developed a risk prediction model to predict the risk of dementia in aMCI patients using clinical features and neuropsychological results. Previous studies have incorporated imaging, genetic, and cerebrospinal fluid biomarkers into prediction models. However, biomarker studies are relatively expensive and sometimes unavailable depending on the clinical situation. Our risk prediction model based on neuropsychological tests is useful because neuropsychological test results can be easily obtained in any clinical setting. This paper highlights our recent study findings on the risk differences in the conversion to dementia according to neuropsychological test results and as well as the risk prediction model developed by our group.
STRUCTURAL AND PROGNOSTIC DIFFERENCES ACCORDING TO NEUROPSYCHOLOGICAL TEST RESULTS
Single-domain versus multi-domain
It is common to classify aMCI into single-domain versus multi-domain [2]. The results from our magnetic resonance imaging (MRI) study suggested that there is a hierarchical relationship between single-domain aMCI (single-aMCI) and multi-domain aMCI (multi-aMCI) [17]. Compared with normal controls (NCs), single-aMCI patients showed cortical thinning in the left medial temporal lobe and multi-aMCI patients showed cortical thinning in the left temporal lobe, precuneus, and the anterior and inferior basal temporal and insular and temporal association cortices. Additionally, multi-aMCI patients had significant cortical thinning in the left precuneus when compared with single-aMCI patients.
In line with the structural difference between single-aMCI and multi-aMCI patients, there was significant difference in the risk of conversion to dementia between the two groups [18]. Multi-aMCI patients had a significantly higher dementia risk than single-aMCI patients (odds ratio [OR], 3.60; 95% confidence interval [CI], 1.78 to 7.29). These results show that there are structural and prognostic differences and suggest that multi-aMCI lies between single-aMCI and AD dementia.
Visual vs. verbal memory impairment
Both verbal and visual memory tests are used in the diagnosis of aMCI [5,19]. To determine if there is a structural difference in the brain depending on the type of impairment (i.e., visual or verbal memory), we compared the topographic pattern of cortical thinning among three subtypes of aMCI: aMCI with predominant verbal memory impairment (verbal-aMCI), aMCI with predominant visual memory impairment (visual-aMCI), and aMCI with both verbal and visual memory predominant impairment (both-aMCI) [20]. Patients with verbal-aMCI showed significant cortical thinning in the left anterior and medial temporal regions compared with NC, while visual-aMCI patients did not. Furthermore, the cortical thinning pattern of the both-aMCI group included that found in the verbal-aMCI group, but was more widespread, with involvement in the bilateral temporal regions.
In terms of clinical course, we evaluated the longitudinal outcomes of aMCI patients according to the modality of the memory impairment involved [13]. Patients were classified into visual-aMCI, verbal-aMCI, and both-aMCI groups, as described above. When compared with the visual-aMCI group, the verbal-aMCI (OR, 2.09; 95% CI, 1.26 to 3.47; P= 0.004) and both-aMCI (OR, 2.94; 95% CI, 1.89 to 4.55; P < 0.001) groups exhibited a higher risk of progression to dementia. Interestingly, recognition failure was associated with an increased risk of progression to dementia only in the visual-aMCI group. These results suggest that visual-aMCI patients might represent a combination of heterogeneous subgroups and that recognition failure is a crucial component in the identification of patients with true AD pathology. In contrast, verbal-aMCI and both-aMCI are precursors to AD regardless of the presence or absence of recognition failure.
Early-stage vs. late-stage aMCI
aMCI patients can be classified into early-stage (E-aMCI) and late-stage (L-aMCI) according to memory test scores [3]. The concept of E-aMCI is crucial in terms of the early enrollment of aMCI patients into clinical trials. To evaluate whether E-aMCI may represent a very early stage of AD, we compared the patterns of cortical thinning between E-aMCI and L-aMCI patients [21]. aMCI patients were divided into an E-aMCI group (scores between -1.5 standard deviations [SD] and -1.0 SD from the mean) and an L-aMCI group (scores lower than -1.5 SD from the mean). Compared with NC, the E-aMCI group showed significant cortical thinning in the left medial temporal and insular regions. By contrast, the L-aMCI group showed cortical thinning in more widespread regions, including the bilateral dorsolateral prefrontal, and anterior and medial temporal and temporoparietal association cortices, as well as the precuneus. The presence and location of atrophy in the E-aMCI group suggests that E-aMCI represents a true pathological state of very early AD, since the medial temporal and insular regions are known to be involved in the earliest stage of AD pathology [22]. The widespread pattern of cortical thinning in L-aMCI patients and the similarity of the atrophy patterns with that of AD dementia [23,24] suggest that L-aMCI may be a transitional state between E-aMCI and AD dementia.
In a multi-center study by our group, the clinical course of E-aMCI and L-aMCI groups was compared [25]. The annual conversion rate was 10.6% in the E-aMCI and 20.2% in the L-aMCI group. Cox analysis revealed that the risk of AD conversion was higher in L-aMCI than in E-aMCI (hazard ratio, 2.26; P= 0.02) after controlling for age, gender, and baseline MMSE score.
DEVELOPMENT OF A PREDICTION MODEL OF THE CONVERSION TO DEMENTIA
A nomogram is designed to help clinicians and patients in risk assessment and predicting outcomes of treatment based on specific patient and disease characteristics [16]. They can easily be applied in complex and busy clinical environments due to their advantages of the involvement of visual displays and their simplicity.
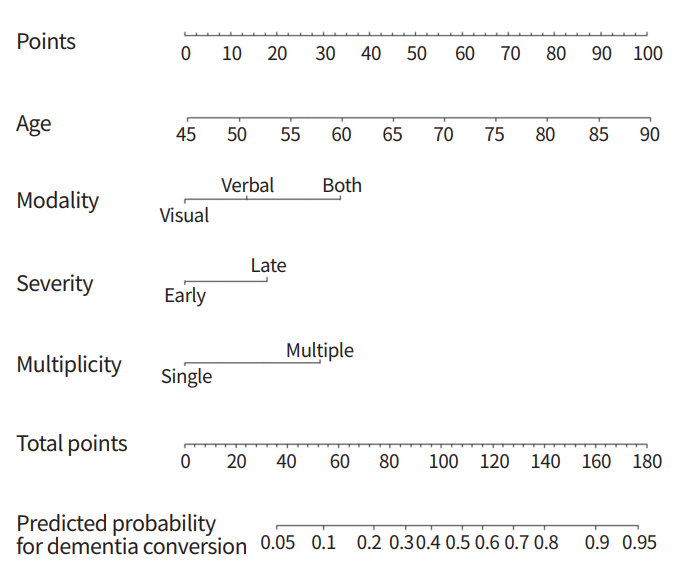
Based on the results of group analyses, we developed a nomogram to predict the risk of the conversion to dementia in aMCI patients using clinical features and neuropsychological results [18]. A total of 338 aMCI patients were included in the analysis. The results of a multivariable logistic regression showed that individuals with both-aMCI (OR, 4.30; 95% CI, 1.95 to 9.47), L-aMCI (OR, 2.15; 95% CI, 1.06 to 4.36), and multiple-aMCI (OR, 3.60; 95% CI, 1.78 to 7.29) all had a significantly higher dementia risk than those with visual-aMCI, E-aMCI, and single-aMCI, respectively. The prediction performance (C-statistics) of our model was 0.77 in the original data and 0.75/0.79 in the internal/external validation. The nomogram is shown in Fig. 1. A specific point was matched to each variable based on the beta coefficients from the regression analyses. The total points, determined from the sum of each point, were used to indicate the overall risk score.
DISCUSSION
Recently, aMCI has become regarded not just as a transitional state between normal cognition and AD dementia, but also as the most crucial stage for studies and clinical trials. In clinical practice, aMCI patients require more detailed counseling than demented patients due to the uncertainties in their clinical outcomes. Therefore, understanding the natural course of aMCI and predicting its prognosis is important in both research and clinical aspects.
Our studies on the structural changes occurring in aMCI patients have provided us with some perspectives on the hierarchical orders of aMCI. Patients with multi-aMCI, both-aMCI, and L-aMCI showed more widespread cortical thinning patterns than patients with single-aMCI, verbal-aMCI, or E-aMCI [17,20,21]. However, structural changes were also detected in single-aMCI, verbal-aMCI, and E-aMCI patients, and the patterns of cortical thinning were consistent with the known early involvement of AD pathology. These results suggest that on the spectrum from NC to AD dementia, multi-aMCI, both-aMCI, and L-aMCI lie closer to AD dementia than single-aMCI, visual-aMCI, and E-aMCI. The hierarchical order between both-aMCI and verbal-aMCI seems clear, but because the visual-aMCI patients did not show significant cortical atrophy, more evidence is needed before conclusions can be drawn regarding visual-aMCI.
The conversion from aMCI to dementia might be the most important issue for aMCI patients. Results from our group have shown that multi-aMCI, verbal-aMCI, both-aMCI, L-aMCI, and positive amyloid PET scans are predictors of dementia conversion in aMCI patients [13,25]. Until recently, most studies on aMCI have been group-based analyses. To be able to readily apply our study results in clinical practice, we have developed a prediction model in the form of a nomogram to predict the 3-year risk of conversion to dementia in aMCI patients. The risk prediction model showed fair discrimination (C-statistics, 0.77) and calibration capabilities.
In previous studies, several prediction models using biomarker information such as the levels of Aβ in the cerebrospinal fluid, amyloid deposition on PET, and atrophy measured on brain MRI have been created [26-29]. However, biomarker studies are relatively expensive, difficult to conduct, and are sometimes unavailable depending on the clinical situation. In addition, data from advanced biomarker studies sometimes require complicated processing procedures that clinical sites may not be able to perform. Our prediction model is useful in clinical settings because it is based on neuropsychological test results that are easy to obtain and that do not require complex preprocessing.
CONCLUSION
Research on aMCI has been transformed due to the recent advances in imaging technology and the accumulation of patient data. Amyloid PET scans are increasingly used in clinical settings, and tracers for tau PET are being developed. Additionally, machine-learning techniques have enabled for automated image analysis at the individual level. However, these state-of-the-art technologies have both advantages and disadvantages. These technologies make more accurate diagnoses and the individualization of treatment possible but are prone to non-medical problems such as high costs and poor availability. Fortunately, our results regarding prediction models demonstrate that decent predictive accuracy can be achieved from readily accessible data. The key to future research in the field of dementia might be the incorporation of advanced techniques into research models as well as ensuring such models are ready and available for use in clinical practice.