


INTRODUCTION
Narcolepsy is a chronic neurological disorder characterized by excessive daytime sleepiness, disruption of sleep-wake behavior, cataplexy, and other rapid eye movement (REM) sleep phenomena, such as sleep paralysis and hypnagogic hallucination [1]. Cataplexy is sudden episodes of partial or complete paralysis of voluntary muscles, triggered by emotional stimulation [2]. Hypocretin transmission is essential for maintaining wakefulness, as well as sleep, via widespread connections with other neuromodulators that also modulate wake/sleep [3]. Studies in animal models have shown that deficient hypocretin transmission causes narcolepsy with cataplexy [4], and lower cerebrospinal fluid hypocretin levels have been observed in those with narcolepsy with cataplexy [5].
Narcolepsy with cataplexy is one of the most studied sleep disorders in a number of scientific fields. In particular, neuroimaging has been extensively performed to investigate the pathophysiology and anatomical correlates of the characteristic symptoms of disease, such as cognitive or emotional problems and sleep-wake disturbances. The neuroimaging techniques employed to explore narcolepsy include structural, functional, and neurochemical imaging. In this review, neuroimaging findings using structural magnetic resonance imaging (MRI), which exams the whole brain structures, and diffusion tensor imaging (DTI), which evaluates white matter (WM) integrity, are presented. Structural imaging may elucidate the neuroanatomical correlates responsible for the various symptoms of narcolepsy, as well as relevant pathomechanisms.
NEUROIMAGING EXPLORATION OF GRAY MATTER IN NARCOLEPSY
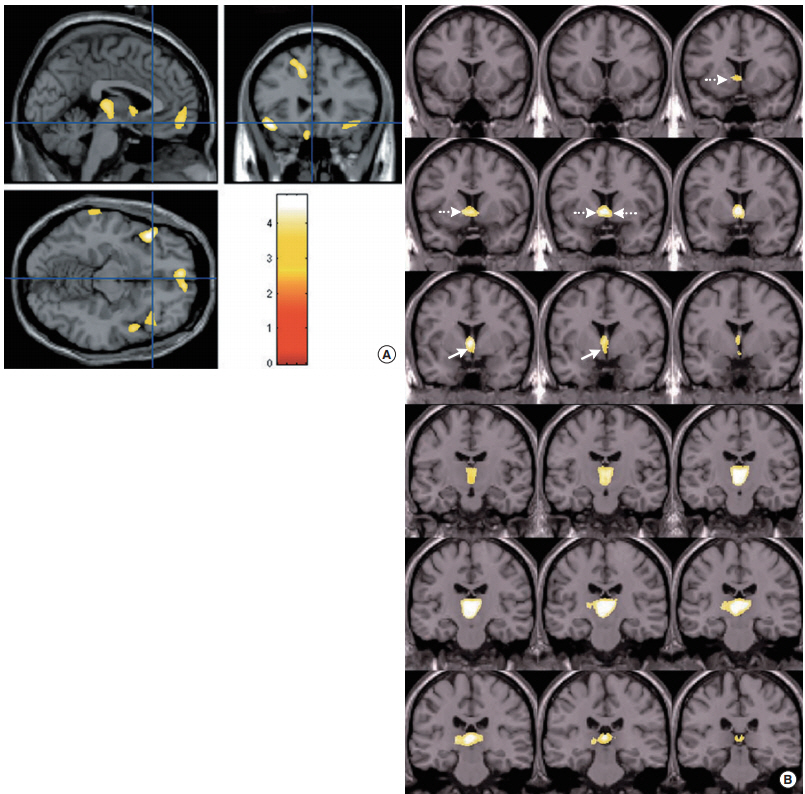
Decades ago, the first published neuroimaging paper reported an abnormality of the pontine reticular formation, where REM sleep is generated, in the brain MRIs of three idiopathic tic patients [6]. Another study, however, could not reproduce this finding [7]. Until now, it has been widely accepted that brain MRIs of individuals with idiopathic narcolepsy are normal by routine visual inspection [8]. Abnormalities of brain structure can be investigated using more delicate and updated technologies such as voxel-based morphometry (VBM) in group analyses. VBM visualizes between-group differences, statistical comparisons of tissue composition, and gray matter (GM) versus WM across all brain regions, with high-resolution scans. There have been several VBM studies in patients with narcolepsy, but findings from this studies have been ambiguous. The initial study did not find any structural changes in narcoleptic patients [9]; however, most of studies reported significant decreases in gray matter volume (GMV) or concentration (GMC) [10-15]. Two of studies showed decreases in GMC [10] or GMV [11] in the hypothalamus. They suggested that neuronal losses affected the hypothalamus and related hypocretinergic structures, as well as major sites of hypocretin projections and the nucleus accumbens. Two studies showed decreases in GMV in the inferior temporal/frontal [12] and right prefrontal/frontomesial regions [13], contributing to cognitive impairments, such as attentional deficits [14]. The most recent study [15] demonstrated reduced GMC in the bilateral thalami, left gyrus rectus, bilateral frontopolar gyri, bilateral short insular gyri, bilateral superior frontal gyri, and right superior temporal and left inferior temporal gyri in patients with narcolepsy compared to healthy controls (Fig. 1A). Small volume correction emphasized GMC reduction in the bilateral nucleus accumbens, hypothalami, and thalami (Fig. 1B). Reduced GMC in the hypothalamus and nucleus accumbens supported the hypothesis that these reductions are associated with daytime sleepiness and cataplexy in narcolepsy patients. It also suggested that the structural substrates showing decreased GMC might be responsible for wake-sleep controls, attention, or memory.
There were differences in both methodology (the statistical parametric mapping [SPM] version, modulated or unmodulated, grand mean scaling, absolute or relative thresholding, and sample size) and the composition of patients in the studies (the presence of cataplexy, disease duration, drug naivety, accompanying symptoms). Four showed GMV changes [11-13] and two [10,15] reported GMC reductions in patients. Optimized VBM can quantify GM differences between subjects; both differences in the relative distribution of GMC and absolute differences in GMV [16]. It is not clear whether GMV or GMC is more a more sensitive detection method for structural abnormalities in the brain. However, brain regions showing decreased GMV or GMC across the studies are likely to be important in the development of narcolepsy. Patients’ characteristics are quite variable between studies. In three studies, more than half of the patients were medicated for daytime sleepiness [9,12,13], and, in another two studies, medication history was not mentioned [10,11]. Only one report included drug-naïve narcolepsy patients [15]. It is not certain to what degree structural factors might be affected by medication. However, from a research standpoint, it is likely important to enroll patients with more homogenous features, including medication history, in future studies.
In summary, VBM studies have been able to demonstrate significant GM deficits in narcoleptics with cataplexy. Those areas affected included structures that may potentially play roles in sleep-wake control, attention, or memory. These findings may explain cerebral disturbances in patients with narcolepsy with cataplexy.
Although VBM has definite potential to help elucidate the pathophysiology of narcolepsy, it has practical limitations. VBM methods can be inaccurate in representing GM morphology and localization in the sulci regions where the fine details of anatomy are often obscured by a partial volume effect. Measuring cortical thickness using the cortical surface has been suggested, in studies of GM morphometry, as a strategy for overcoming the limitations of volumetric analyses [16,17]. Cortical thickness analysis, performed at the nodes of a 3-dimensional polygonal mesh, has the advantage of providing a direct quantitative index of cortical morphology [18]. In contrast with GMC or GMV analyses, cortical thickness measured from cortical surfaces differentiates between cortexes of opposing sulci walls within the same sulci bed, enabling more precise measurement in deep sulci and analysis of morphology as a cortical sheet [18].
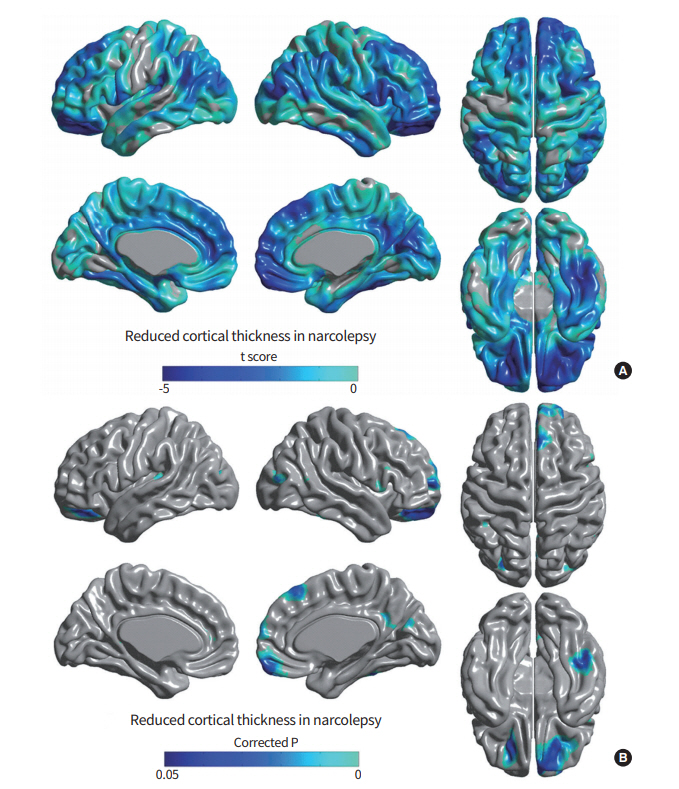
Only one paper has been published employing this method, which demonstrated that, after controlling for age, sex, and intracranial volume, there are significant differences in cortical thickness between patients with narcolepsy and control subjects (P < 0.05, 2-tailed) [19]. Regionally, cortical thickness was decreased in the orbitofrontal gyri, dorsolateral and medial prefrontal cortexes, insula, cingulate gyri, middle and inferior temporal gyri, and inferior parietal lobule of the right and left hemispheres in narcolepsy with cataplexy patients, compared to healthy controls (Fig. 2) [19]. Also, significant correlation was observed between cortical thinning in the left supramarginal gyrus and the score on the Epworth Sleepiness Scale (indicator of daytime sleepiness degree), and between cortical thickness in the left parahippocampal gyrus and scores of general depressive symptoms on the Beck Depression Inventory. Cortical thinning of the prefrontal and limbic cortices and parietal cortex in narcolepsy might be neuroanatomic correlates of the disturbances in attention, memory, and emotion, as well as the sleepiness observed in narcolepsy. The procedures for measuring cortical thickness are quite consistent, providing more stable results, with less subject-to-subject variation between laboratories [20]. It has been shown that the spatial distribution of cortical thinning [19] and that of the reduced GMCs observed in a VBM study [15] were similar, even though the population of narcolepsy patients and the study periods were different. Cortical thinning of the dorsolateral prefrontal, orbitofrontal, and temporal cortexes is consistent with the areas in which we observed significantly reduced GMCs in narcolepsy patients [15]. The similarities between the results of VBM and cortical thickness studies suggest that those findings are more reliable for revealing the neural substrates of the clinical symptoms and pathophysiology of narcolepsy.
Progression of structural or functional changes in narcolepsy has been well studied, since it may provide information regarding the pathophysiology of disease. Neuroimaging technology is suitable for longitudinal studies, and, in narcolepsy, cataplexy occurs after daytime sleepiness has been present for a number of years, and the disorder can exhibit a slow progression of symptoms [21]. This gradual disease progression raises a fundamental question as to whether or not the brain structural abnormalities found in narcolepsy result from progressive hypocretin degeneration. Previous MRI studies were cross-sectional in design and could not adequately address if disease progression led to the structural abnormalities observed in the brains of narcolepsy patients. Recently, brain structural changes during narcolepsy progression have been investigated [22]. Analysis of longitudinally collected brain MRIs from patients (interval: 4.7±1.9 years) revealed widespread, progressive cortical thinning in the dorsolateral frontal, right anterior cingulate, and fusiform cortices, which were found bilaterally (corrected P < 0.05). It also revealed the novel finding that patients with early-onset had faster cortical thinning. However, this study had relatively small sample size (n= 17), which limits the generalizability of the longitudinal analysis results. A more careful investigation of the underlying mechanism with larger sample size is required.
As previously noted, narcolepsy patients suffer from cognitive and emotional dysfunction [23]. Sudden emotional reactions can provoke cataplectic episodes. Such dysfunction in the arousal system is known to be associated with hypocretin. The amygdala contains dense hypocretin/orexin fibers and receptors and is a primary site in the limbic system where hypocretin-containing neurons project [24]. Accordingly, hypocretin-mediated amygdalar dysfunction may be linked with key symptoms of narcolepsy.
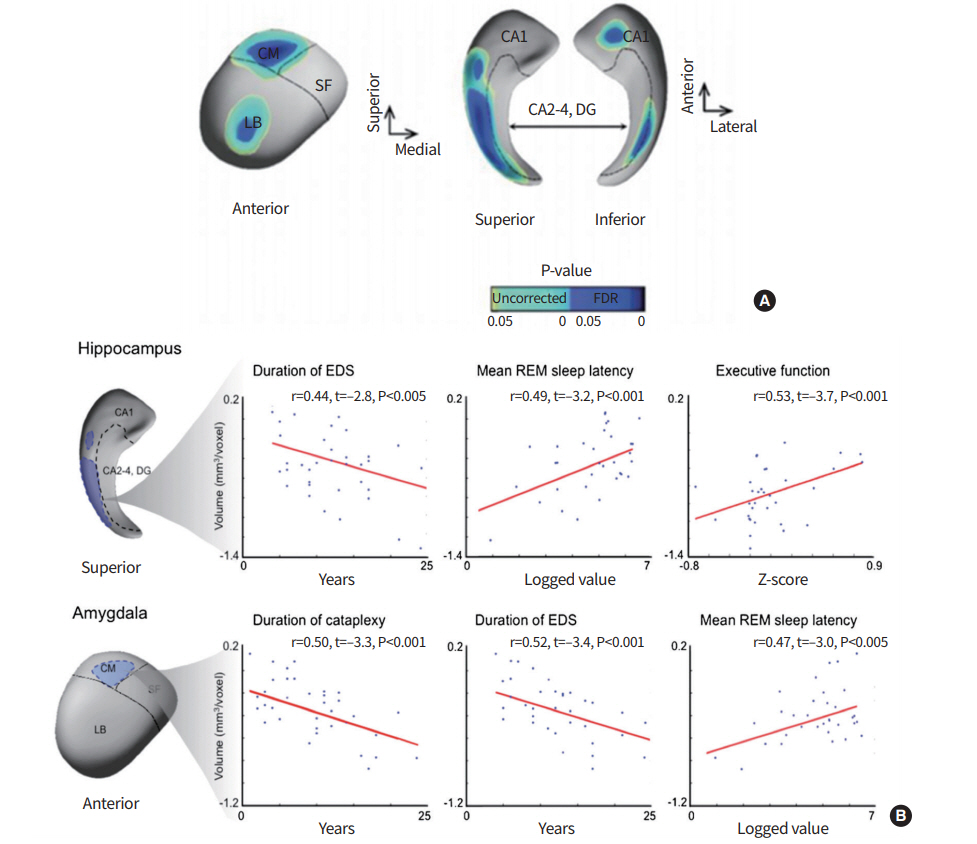
To evaluate structural changes in relevant brain regions, manual labeling of the hippocampus was performed, and revealed bilateral volume reduction in narcolepsy patients compared to healthy controls. A significant association between mesiotemporal lobar volume and clinical symptoms of narcolepsy was also noted [25]. Amygdalohippocampal structures consist of subfields, or subnuclear divisions, which are cytoarchitectonically and functionally distinctive. Encoding and decoding of memory and emotion in these structures are processed through different neural circuits that involve series of different subfields [26,27]. There have been few studies that have investigated the structural integrity of the mesiotemporal lobe structures, due to excessive manual work required for boundary delineation [28]. Therefore, subfield analyses of the amygdalar and hippocampal complex was needed to provide novel insights into the pathophysiology of narcolepsy. A validated, surface-based approach allowed reliable measurement of local volume changes of amygdalohippocampal structures. Manually segmented amygdalae and hippocampi were converted to surface meshes, for which a spherical parameterization was computed using area-preserving, distortion-minimizing mapping [29]. After comparing hippocampal and amygdalar subfield volumes between patients and controls [30], bilateral hippocampal atrophy was found to be primarily located within the cornu ammonis 1 (CA1) subfield in narcolepsy patients (false discovery rate < 0.05) (Fig. 3). After controlling for depressive mood, sleep quality, age, and gender, hippocampal CA1 atrophy and amygdalar-centromedial atrophy were found to be associated with longer duration of daytime sleepiness and shorter mean REM sleep latency (|r|> 0.44, P< 0.01). Amygdalar-centromedial atrophy was associated with longer duration of cataplexy (|r|> 0.47, P< 0.005). This suggested that atrophy in the centromedial area of the amygdala and CA1 of the hippocampus might be closely related to the severity of narcolepsy, and play a crucial role in the circuitry of cataplexy. Amygdalohippocampal subfield analysis may provide new perspectives regarding how neural substrates are associated with key features in narcolepsy.
NEUROIMAGING EXPLORATION OF WHITE MATTER IN NARCOLEPSY
Functional imaging studies and VBM analysis of brain MRI showed abnormalities in the hypothalamus-thalamus-orbitofrontal pathway, revealing altered hypocretin pathways in narcolepsy. These distinct morphometric changes could account for deficits in wake-sleep control, attention, and memory seen in this disease. It also suggests that it is necessary to evaluate WM changes in patients with narcolepsy. DTI is a quantitative MRI technique that measures the random motion of water within the tissue microstructure in the brain [31]. Fractional anisotropy (FA), a common DTI measurement, is a scalar parameter of the degree of anisotropy, and is related to myelination, axon density, and packing density fiber bundle [32]. The mean diffusivity (MD) is a quantitative measure of the mean motion of water, and is affected by cellular size and neuropil numbers [32,33].
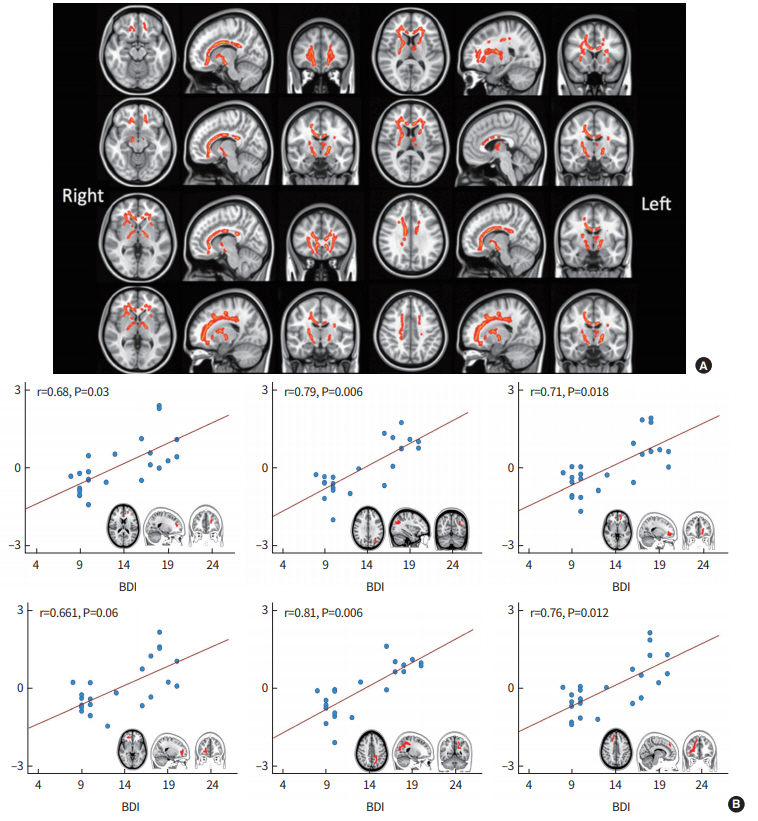
WM exploration in narcolepsy had been conducted in three studies [34-36]. In this VBM-style DTI analysis [34,35], each subject’s DTI scalar map is normalized into a common space, and then voxel-wise statistics were performed to find group differences or correlations of interests. There is debate regarding the technical limitations of VBM-style approaches due to inaccurate alignment between subjects and ambiguity in choosing the extent of smoothing [37-40]. Another study used tract-based spatial statistics (TBSS) [36], which may alleviate some of the limitations of VBM-style approaches, to observe WM changes in the hypothalamus, midbrain, medulla, and bilateral frontal lobe in patients. FA and MD from whole-brain DTI and TBSS may help identify the localization of WM changes. Recently, drug-naïve patients exhibited significant FA decreases in the bilateral cingulate gyri, corpus callosum genu, fronto-orbital area, anterior limb of the internal capsule, as well as the WM of the left anterior and medial thalamus (Fig. 4A) [41]. After Bonferroni correction for multiple comparisons, significant positive correlations were found between depressive mood and MD in the bilateral superior frontal gyri, bilateral fronto-orbital gyri, and right superior parietal gyrus in narcoleptic patients (Fig. 4B). DTI-TBSS avoids inaccurate alignment between subjects as well as ambiguity in choosing the extent of smoothing that were limitations of DTI-VBM. This study suggests there is widespread disruption of WM integrity and prevalent brain degeneration of frontal lobes that are associated with depressive symptoms in narcolepsy. It should be noted that DTI studies of narcolepsy have commonly reported decreased FA in the WM of the fronto-orbital and cingulate area in patients.
CONCLUSION
Structural neuroimaging has provided significant clues as to brain regions that might be responsible for pathophysiology and symptomatology in narcolepsy. Sophisticated MRI techniques allow in vivo visualization of human brain anatomy with exquisite details and quantification of morphological changes. Narcolepsy with cataplexy has associated structural abnormalities in the hypothalamus and thalamus, in line with a loss of hypocretinergic neurons, as well as various cortical/subcortical regions, in relation with cataplexy and cognitive and mood disturbances.