


INTRODUCTION
Among breast imaging methods, mammography is widely used in screening for breast cancer [1]. However, the results can be difficult to interpret for dense breasts, which leads to a high risk of misdiagnosis [2]. Forthis reason,there has been ongoing research on computer-aided diagnosis (CAD) systems, in order to reduce the number of misdiagnoses and to improve the accuracy of diagnosis by radiologists using mammography [3-5]. CAD systems use computer algorithms to enable objective and accurate detection of lesions that are difficult to distinguish with the naked eye. However, accurate lesion detection by these CAD systems can be negatively affected for various reasons. In particular, in CAD systems used to diagnose breast cancer, the pectoral muscle shows a similar pixel intensity to that of lesions of the right mediolateral oblique (RMLO) and left mediolateral oblique (LMLO) muscles, which can cause misdetection [6]. To prevent this, a separate pectoral muscle detection algorithm is required.
In 2016, we developed an image processing-based automated pectoral muscle detection algorithm using the random sample consensus (RANSAC) algorithm on images from the Mammographic Image Analysis Society (MIAS) database [7]. This algorithm had a detection accuracy of 92.2%, which was higher than that found in other studies using the MIAS database [8-12]. Nevertheless, detection accuracy was poor in some images due to the complex shape of the pectoral muscle, and so the algorithm needed to be improved.
Recently, the number of researches on pectoral muscle segmentation using computer algorithms are increasing. Shen et al. [13] reported an algorithm for automatic pectoral muscle segmentation that combines a genetic algorithm and a morphological selection algorithm. As a result of verification with the Mini-MIAS database, the false positive (FP) rate was 2.03% and the false negative (FN) rate was 6.90%. Gardezi et al. [14] reported an algorithm of segmenting the boundary between the breast region and the breast parenchyma using an adaptive gamma correction method. As a result, an accuracy of 98.45% and a jaccrard similarity index of 92.79% were shown.
Recent advances in hardware have created a favorable environment for deep learning techniques, which have been applied in various fields. Convoluted neural networks (CNNs) especially, as one type of deep learning technique, have been used with outstanding results in various imaging fields [15,16]. In medical imaging as well, numerous studies using CNNs have reported better performance than conventional image processing techniques [17-19]. Thus, in this study, we aimed to use deep learning in pectoral muscle detection, to improve upon the previously encountered problems for the complex-shaped pectoral muscle, and to enhance detection accuracy. The deep learning model for pectoral muscle detection was trained using the same MIAS database as before, and the performance of the algorithm was assessed in comparison to the results ofthe image processing-based method using RANSAC.
METHODS
Data
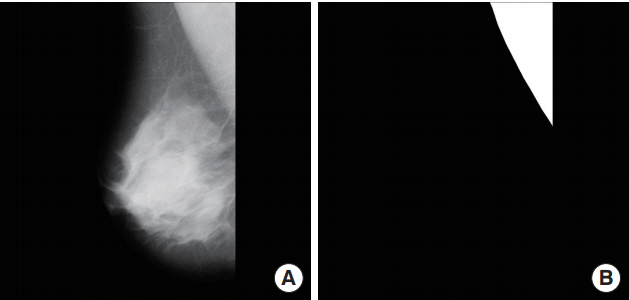
This study used mammograms from the mini-MIAS database, which is one of several open access databases. The MIAS database consists of scans of 322 mammogram films taken as part of the United Kingdom’s national breast cancer screening program [20]. All the images in the mini-MIAS database consist of RMLO or LMLO views excluding right craniocaudal and left craniocaudal, and the images sizes are 1,024×1,024 pixels. For annotation data to use in deep learning,regions of interest (ROIs) for the pectoral muscle were drawn manually by a radiologist. The ROIs were drawn using ImageJ software version 1.52a (National Institutes of Health, Bethesda, MD, USA). In the mediolateral oblique images, polygonal ROIs were drawn by distinguishing the boundary between the breastregion and the breast parenchyma. A binary mask was made, using 0 for outside the ROI and 255 for inside the ROI, and this was used as the ground truth. Fig. 1 shows one of the binary mask images used as the ground truth.
The size ofthe data set used in this study was notlarge, and so 5-fold cross validation was used to ensure that the model would be robust in terms of data dependency. For each cross validation, 80% of the overall data (257 to 258 scans) was used as learning data, and 20% (64 to 65 scans) was separately constructed and used as test data. Each data point was used exactly once as test data, without duplication.
Development environment
The system for deep learning consisted of 4 NVIDIA TITAN Xp (NVIDIA Corp., Santa Clara, CA, USA) graphics processing units, a Xeon E5-1650 v4 (Intel Corp., Santa Clara, CA, USA) central processing unit, and 128 GB of random access memory (RAM). Deep learning was conducted using Python 2.7.6 and the Keras 2.1.5 framework (Python Software Foundation, Wilmington, DE, USA) with a TensorFlow backend in the Ubuntu 14.04 operating system (Canonical Ltd., London, UK).
Data augmentation
The images from the MIAS database used in this experiment were insufficient to train the deep learning model. Data augmentation was performed to acquire a sufficient quantity of learning data [21]. An arbitrary combination of flips, rotations, translations, and stacking were used to expand the learning data set 20-fold.
Training the deep learning model
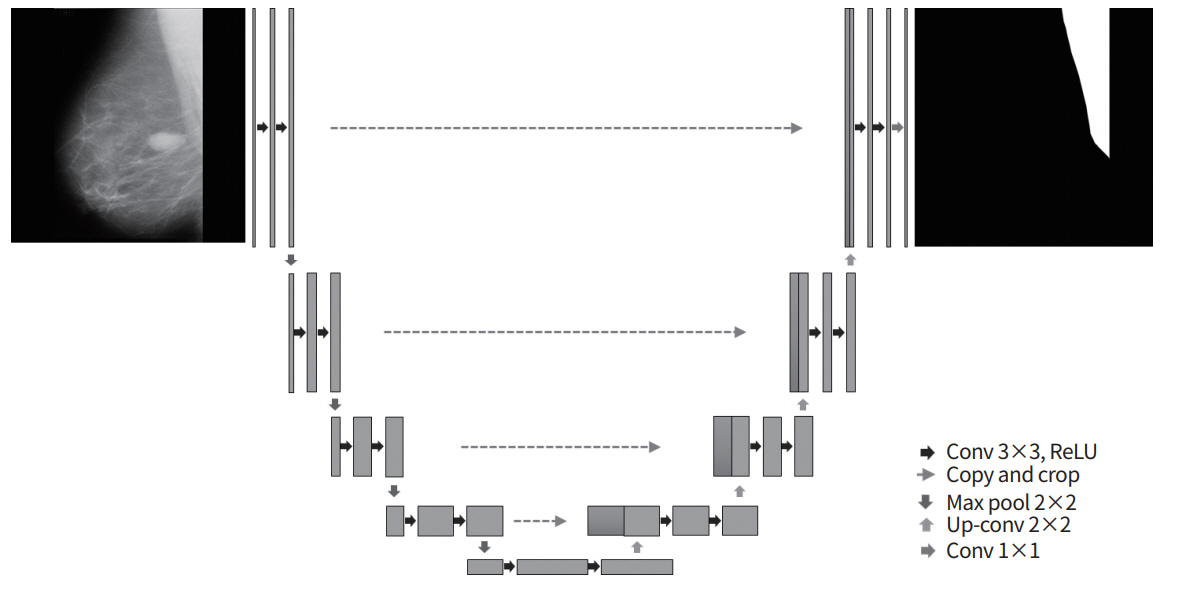
For the CNN in this study, the U-Net model was used. One advantage of the U-Net model is that it has a structure that re-uses encoding and decoding phases via skip connections (Fig. 2); as a result, when images are reconstructed using the network, the original image can be reconstructed without losing even fine details, meaning that the output images have excellent quality [22,23]. The U-Net architecture was composed of 23 layers, the number of parameters used was 5,142,433, and the Jaccard loss function was used. For the learning environment, the batch size was set to 8, and the number of epochs was fixed to 300 based on an Adam optimizer. The learning rate was set to 0.001 up to epoch 100, 0.0001 from epoch 100 to 250, and 0.00001 from epoch 250 to 300.
RESULTS
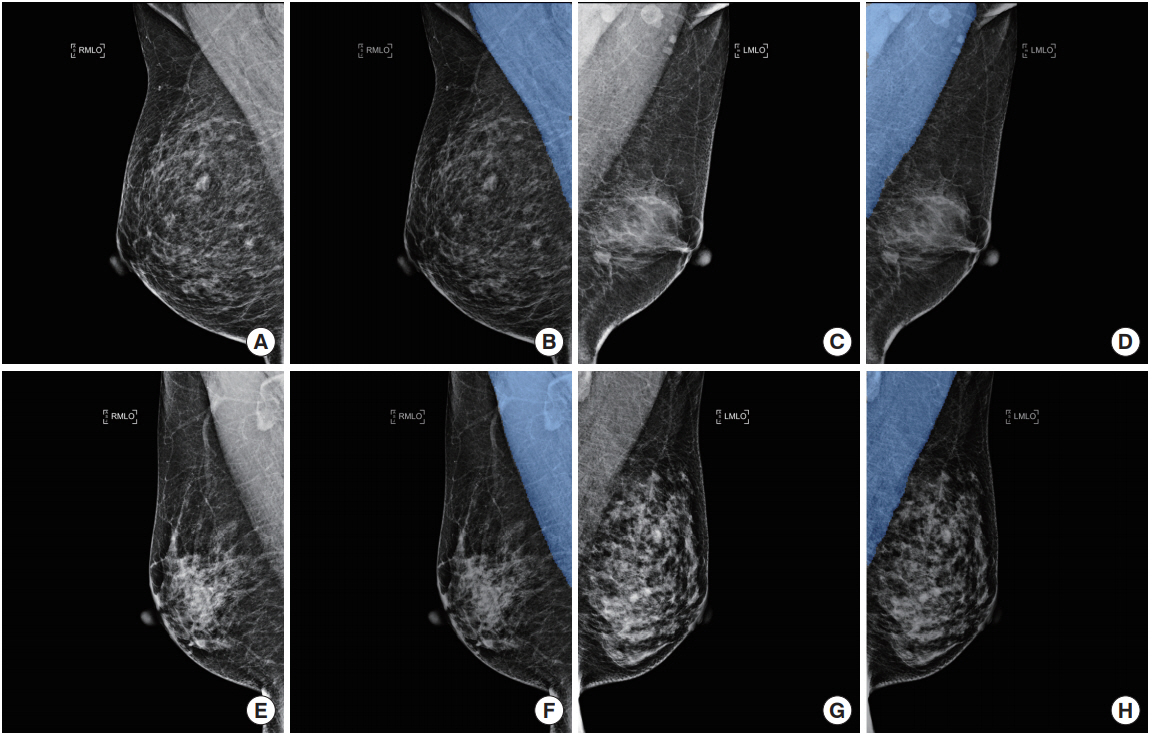
In this study, deep learning was used to train a model to detect pectoral muscle in MIAS database images. The trained model was applied to separately constructed test data to assess its performance. Fig. 3 compares the ground truth data from the test data with the results automatically extracted using the trained model.
For each cross validation, the model was tested using four statistical indices: sensitivity, specificity, accuracy, and dice similarity coefficient (DSC). The extracted results of the deeplearning model were compared pixel-by-pixel with the ground truthdata,the truepositive (TP), FP,truenegative, andFNrates were calculated, and the statistical indices were calculated using the equations below. From the results of the five cross validations,the mean sensitivity was 95.55%,the mean specificity was 99.88%, the mean accuracy was 99.67%, and the meanDSC was 95.88% (Table 1).
The deep learning-based pectoral muscle detection algorithm was assessed using the same method as our previous study on an image processing-based method using the RANSAC algorithm, and the results of the two models were compared. We assessed the differences between the automated detection results of the deep learning model and the manually drawn ground truth data. Concordance ≥90% between the deep learning-based automated detection and the manual detection images was defined as “good,” concordance ≥50% and <90% was defined as “acceptable,” and concordance <50% was defined as “unacceptable” [7]. The previous method using the RANSAC algorithm showed 264 “good” results, whereas the deep learning model showed 322 “good” results (Table 2). The FP and FN rates of the previous method were, respectively, 4.51%±6.53% and 5.68%± 8.57% (Table 3). In contrast, the FP and FN rates of the deep learningmethod were,respectively, 2.88%±6.05%and4.27%±8.72%.
DISCUSSION
This study proposed a pectoral muscle detection method using deep learning with the MIAS database. Although the proposed method used all the images in the MIAS database, there was too little data to construct a separate validation set. We used 5-fold cross validation to supplement the shortage of validation data and to minimize the data dependency of the model. The proposed model showed high accuracy, with a mean sensitivity of 95.55% and mean DSC of 95.88%.
We also compared the results of the deep learning-based pectoral muscle detection method with a previous image processing-based pectoral muscle detection method using the RANSAC algorithm. While the RANSAC method showed “unacceptable” results for 22 images, the deep learning method did not show “unacceptable” results for even a single image. Moreover, when the misdetection rate was inspected, the RANSAC algorithm showed FP and FN rates <5% for only 56.5% of the images, whereas the deep learning algorithm showed a higher proportion of images (71.0%) with FP and FN rates <5%. These results demonstrate that the deep learning algorithm achieved more accurate and more stable detection results than the RANSAC algorithm.
In image processing, RANSAC is an algorithm for approximation. Approximation cannot guarantee the detection of an accurate pectoral muscle region. Although there have been attempts to approximate the area of a curved pectoral muscle using nonlinear RANSAC, it is quite difficult to accurate approximate the pectoral muscle. This weakness is thought to have led to the 22 “unacceptable” results. In contrast, because deep learning makes an overall judgment about the shape and the relationship attenuation and pixels based on the training images, it requires generalized, diverse training data. In this study, we used the same data set in order to compare the new model objectively with the previous image processing-based pectoral muscle detection algorithm. The data set was somewhat smallto train a deep learning model. The fact that we were still able to obtain relatively good results is thought to be because the shape and position of the pectoral muscle was fairly consistent, and did not differ greatly between patients. Although the possibility of overfitting can be suspected,these doubts can be partially resolved based on the results of cross validation.
This study had some limitations. In current clinical settings, digital mammography is used in most instances, but the MIAS database contains data obtained by scanning film mammograms. Therefore, there is no guarantee that a deep learning model trained on MIAS data will show good results for digital mammograms. In order to resolve this issue, it will be necessary to collect more digital mammograms, and to further train a deep learning model based on the collected data. It will also be important to collect data from diverse medical institutions and devices, and to objectively validate the deep learning modelthrough multi-center validation. We expect that these additional studies would further enhance the clinical reliability of the deep learning-based pectoral muscle detection method proposed in this report.
In conclusion, the experiments in this study demonstrated that the deep learning-based pectoral muscle detection method achieved a more accurate and stable detection rate than a previous image processing-based method. We expect that this type of deep learning technique could be useful to overcome the limitations of conventional image processing techniques.