Validation of new TRUS biopsy techniques for PI-RADS 4 or 5
Article information

Abstract
Purpose
Recently, new magnetic resonance imaging (MRI)-transrectal ultrasound (TRUS) techniques and imaging features of Prostate Imaging and Report and Data System (PI-RADS) 4 or 5 have been reported. The aim of this study was to validate the outcomes of new TRUS-guided biopsy techniques for cancer detection in patients with PI-RADS 4 or 5.
Methods
Between June 2018 and November 2018, 94 men underwent TRUS-guided biopsy after PI-RADS 4 (n=59) or 5 (n=35) was categorized as an index lesion on MRI. For PI-RADS 4 group, target biopsy was performed in 5 and combination biopsy (target and systematic biopsies) was in 54. For PI-RADS 5 group, target biopsy was performed in 19 and combination biopsy was in 16. Target to combination biopsy ratios and significant cancer detection rates (CDRs) were compared between the groups. Significant cancer was defined as a Gleason score ≥ 7 tumor. Standard reference was biopsy examination. Fisher’s exact were used for statistical analysis.
Results
Target to combination biopsy ratios was 5:54 in the PI-RADS 4 group and 19:16 in the PI-RADS 5 group (P<0.0001). The significant CDR of the target biopsy were 42.4% (25/59) in the PI-RADS 4 group and 82.6% (29/35) in the PI-RADS 5 group (P=0.0002). The significant CDR of combination biopsy was 44.1% (26/59) in the PI-RADS 4 group and 85.7% (30/35) in the PI-RADS 5 group (P<0.0001).
Conclusion
New TRUS biopsy techniques provides high significant CDR patients with PI-RADS 4 or 5. Therefore, TRUS should be performed prior to fusion or in-bore biopsy to determine if these categories are visible.
INTRODUCTION
Prostate Imaging and Report and Data System version 2 (PI-RADSv2) has been introduced to use in the clinical practice since 2015 [1-3]. PI-RADSv2 categorizes prostate lesions using magnetic resonance imaging (MRI) features to stratify the risk of prostate cancer. Many studies have validated the utility of PI-RADSv2 in detecting significant cancer [4-9]. MRI-transrectal ultrasound (TRUS) fusion or in-bore MRI biopsy is usually performed to target PI-RADS 4 or 5 because these categories have so strong signal intensities on diffusion-weighted, T2-weighted, and dynamic contrast-enhanced MRI. PI-RADSv2 defines that these categories are likely or highly likely to have significant cancer [1-3].
TRUS is not used for lesion targeting because it is generally accepted that prostate cancer is not clearly seen on TRUS. However, it is still unclear if significant cancer is really invisible on TRUS. Recently, new TRUS techniques and imaging features have been reported to detect significant cancer in patients with PI-RADS 4 or 5 [10]. Only a few articles have introduced the new biopsy techniques to set up the new protocols of TRUS and difference of lesion location between MRI and TRUS [10-13]. Therefore, there is no validation study to show how cancer detection has been improved with these new TRUS features and biopsy. Our hypothesis was that these categories are visible on TRUS and targeted by TRUS due to high incidence of significant cancer. The aim of this study was to validate the outcomes of new TRUS-guided biopsy techniques for cancer detection in patients with PI-RADS 4 or 5.
METHODS
Patient selection
Between June 2018 and November 2018, 166 men underwent TRUS-guided biopsy (Fig. 1). Of these patients, 72 were excluded because of the following criteria: PI-RADS 1–3 (n=64), low (< 2.5 ng/mL) prostate specific antigen (PSA; n=7), and previous treatments (n=1).

Flow diagram for study population. TRUS, transrectal ultrasound; PI-RADS, Prostate Imaging Reporting and Data System; PSA, prostate specific antigen; MRI, magnetic resonance imaging.
The remaining 94 men (median, 67.5 years; range, 40 to 87) met for the following inclusion criteria: high (≥ 2.5 ng/mL) PSA, pre-biopsy MRI, and PI-RADS 4 or 5. Their PSA, prostate volume, PSA density, MRI-biopsy interval, and tumor size ranged 2.8 to 2,783.6 ng/mL (median, 5.7), 12 to 304 mL (35), 0.04 to 108.73 ng/mL2 (0.17), 0 to 646 days (40), and 2.1– to 41.0 mm (12.0), respectively. These patients were divided into PI-RADS 4 group (n=59) and PI-RADS 5 group (n=35). Patient demographics in each group were summarized in the Table 1.
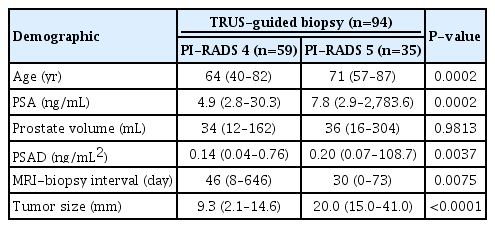
Patient demographics
MRI sequences and biopsy techniques
Multi-parametric MRI was performed prior to prostate biopsy and the MRI sequences included T2-weighted, diffusion-weighted, and dynamic contrast-enhanced axial magnetic resonance (MR) images according to the guidelines of PI-RADSv2 [1-3]. A single radiologist evaluated MR images and categorized PI-RADS 4 or 5 as an index lesion. All biopsies were performed by the same radiologist who had 17-year experience of genitourinary imaging and intervention.
First, target biopsy was performed in PI-RADS 4 and 5 if these categories were visible on TRUS. Then, systematic biopsy was added when tumor margin was not completely visible on TRUS. Determining whether or not the combination biopsy (target and systematic biopsies) was necessary simply depended on how TRUS operator subjectively assessed the lesion visibility on TRUS. He tried to add systematic biopsy as many as possible not to miss significant cancer in the prostate other than PI-RADS 4 or 5. Target cores were sampled within the PI-RADS 4 or 5 and then systematic cores were obtained from the other prostate tissue categorized as PI-RADS 1 or 2.
The biopsy operator was familiar with the following TRUS techniques and imaging features [10]. First, fundamental imaging was used for lesion detection instead of harmonic imaging. Second, the dynamic range of the TRUS was kept at less than 50 to increase the tissue contrast. Third, the prostate was not compressed until PI-RADS 4 or 5 was detected. Fourth, a TRUS lesion was located more superiorly than an MRI lesion if it was closer to the posterior capsule (Fig. 2). Fifth, a TRUS lesion was located more inferiorly than an MRI lesion if it was closer to the anterior capsule (Fig. 3). Six, peripheral and transition cancers appeared to be hypoechoic and hyperechoic, respectively (Figs. 2, 3). Finally, higher-scoring PI-RADS lesions became more hypoechoic or hyperechoic (Figs. 2, 3). According to these TRUS techniques and imaging features, he already had performed TRUS-guided biopsy for targeting 432 PI-RADS 4 or 5 between March 2014 and May 2018.

A 64-year-old man with Prostate Imaging Reporting and Data System (PI-RADS) 4 peripheral cancer. (A) Diffusion-weighted axial magnetic resonance image shows a hyperintense mass (white arrow) in the left mid-gland peripheral zone. The lesion measures 5.3 mm. His prostate specific antigen was 4.28 ng/mL. (B) Transverse transrectal ultrasound (TRUS) image shows that the mass (white arrow) is hypoechoic and located in the left base peripheral zone. TRUS-guided target biopsy confirmed Gleason score 7 (3+4) adenocarcinoma in all target cores (n=4). TRUS-guided systematic biopsy did not detect prostate cancer.

A 69-year-old man with Prostate Imaging Reporting and Data System (PI-RADS) 5 transition cancer. (A) T2-weighted axial magnetic resonance image shows a hypointense mass (white arrowheads) in the left base transition zone. The lesion measures 15.4 mm. His prostate specific antigen was 6.98 ng/mL. (B) Transverse transrectal ultrasound (TRUS) image shows that the mass (white arrowheads) is hyperechoic and located in the left midglnad transition zone. TRUS-guided target biopsy confirmed Gleason score 7 (4+3) adenocarcinoma in all target cores (n=4). TRUS-guided systematic biopsy detected Gleason score 7 (3+4) adenocarcinoma in two cores from sextant cores.
Data analysis
MRI images were not reviewed at Picture Archiving and Communication System (PACS) station to re-categorize prostate lesions with PI-RADSv2. The original PI-RADS scores which were made by a radiologist prior to biopsy, were used for analysis.
Overall cancer detection rate (CDR) was calculated by the number of all cancer cases divided by the number of all biopsy cases in each group or each biopsy. Significant cancer was defined as one with Gleason score (GS) ≥ 7. Significant CDR was calculated by the number of all GS ≥ 7 cases divided by the number of all biopsy cases in each group or each biopsy. Overall and significant CDRs were compared between the groups or between the biopsies.
Positive core rate (PCR) was calculated by the number of all cancer cores divided by the number of all biopsy cores. PCRs were compared between the groups or between the biopsies.
The size of peripheral tumor was measured at diffusion-weighted axial images and that of transition tumor was measured at T2-weighted axial MR images. When a tumor involved both zones, the tumor size was measured depending on the dominant location. Therefore, when a tumor involved peripheral zone more dominantly than transition zone, the tumor size was measured on diffusion-weighted MR images. The median numbers of all or cancer cores obtained by target biopsy were compared between the groups. The median GSs of the target biopsy were compared between the groups.
Statistical analysis
Mann-Whitney test was used to compare patient age, PSA, prostate volume, PSA density, MRI-biopsy interval, tumor size, biopsy core, and GS between the groups. Fisher’s exact test was used to compare CDRs and PCRs between the groups or the biopsies. Odds ratio was obtained to quantify the strength of the association between the groups. The approximation of Woolf was used to calculate 95% confidence interval.
Commercially available software (PASW Statistics version 20.0, IBM Co., Armonk, NY, USA) was used for statistical analysis. A two-side P-value of less than 0.05 was considered statistically significant.
Ethical statement
This retrospective study was conducted on human and was approved by Institutional Review Board of Samsung Medical Center (IRB number: 2019-02-102-001). Informed consent was waived.
RESULTS
PI-RADS 4 group had younger age (P=0.0002), lower PSA (P=0.0002), lower PSA density (P=0.0037), longer MRI-Biopsy interval (P=0.0075), and smaller tumor size (P<0.0001) than PI-RADS 5 group (Table 1). There was no difference between the groups in terms of prostate volume (P=0.9813). The peripheral to transition lesion ratio was 56:3 in the PI-RADS 4 group and 17:18 in the PI-RADS 5 group (P<0.0001). The peripheral to transition cancer ratio was 31:3 in the PI-RADS 4 group and 16:17 in the PI-RADS 5 group (P=0.0002). The median number of target cores was 6 (2 to 11) in the PI-RADS 4 group and 6 (2 to 12) in the PI-RADS 5 group (P=0.5089). The median number of target cancer cores was 5 (0 to 10) in the PI-RADS 4 group and 5 (0 to 9) in the PI-RADS 5 group (P=0.9498). The median GS was 7 (6 to 8) in the PI-RADS 4 group and 7 (6 to 8) in the PI-RADS 5 group (P=0.0750).
The overall CDR was 57.6% (34/59) in the PI-RADS 4 group and 94.3% (33/35) in the PI-RADS 5 group (P=0.0001) (Table 2). The significant CDR was 44.1% (26/59) in the PI-RADS 4 group and 85.7% (30/35) in the PI-RADS 5 group (P<0.0001). The PCR was 26.7% (188/703) in the PI-RADS 4 group and 58.5% (175/299) in the PI-RADS 5 group (P<0.0001). The target to combination biopsy ratio was 5:54 in the PI-RADS 4 group and 19:16 in the PI-RADS 5 group (P<0.0001).
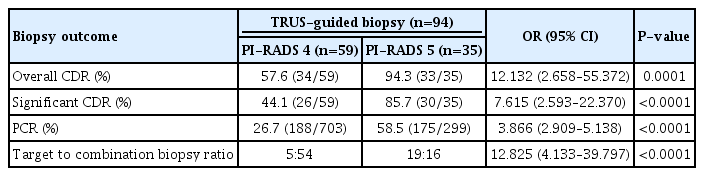
Comparison of biopsy outcomes between PI-RADS 4 and 5
The overall CDR of the target biopsy was 52.5% (31/59) in the PI-RADS 4 group and 91.4% (32/35) in the PI-RADS 5 group (P<0.0001) (Table 3). The significant CDR of the target biopsy were 42.4% (25/59) in the PI-RADS 4 group and 82.6% (29/35) in the PI-RADS 5 group (P=0.0002). The PCR of the target biopsy were 44.0% (159/361) in the PI-RADS 4 group and 77.7% (157/202) in the PI-RADS 5 group (P<0.0001).
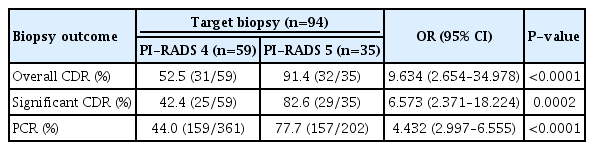
Comparison of target biopsy outcomes between the PI-RADS 4 and 5
The overall CDR of the systematic biopsy was 31.5% (17/54) in the PI-RADS 4 group and 50.0% (8/16) in the PI-RADS 5 group (P=0.2363) (Table 4). The significant CDR of the systematic biopsy was 13.0% (7/54) in the PI-RADS 4 group and 25.0% (4/16) in the PI-RADS 5 group (P=0.2589). The PCR of the systematic biopsy was 8.5% (29/342) in the PI-RADS 4 group and 18.6% (18/97) in the PI-RADS 5 group (P=0.0083).

Comparison of systematic biopsy outcomes between PI-RADS 4 and 5
The overall CDR of the combination biopsy was 53.7% (29/54) in the PI-RADS 4 group and 87.5% (14/16) in the PI-RADS 5 group (P=0.0189) (Table 5). The significant CDR of the combination biopsy was 38.9% (21/54) in the PI-RADS 4 group and 81.3% (13/16) in the PI-RADS 5 group (P=0.0040). The PCR of the combination biopsy was 22.4% (149/664) in the PI-RADS 4 group and 43.5% (84/193) in the PI-RADS 5 group (P<0.0001).

Comparison of combination biopsy outcomes between PI-RADS 4 and 5
Of 34 cancer-proven PI-RADS 4 cases, 14 were diagnosed by both, 17 by target biopsy (Fig. 2), and 3 by systematic biopsy. The three cancers detected by systematic biopsy alone were all GS 6 tumors. Systematic biopsy detected a GS 7 tumor which was underscored as GS 6 tumor by target biopsy. Of 33 cancer-proven PI-RADS 5 cases, seven were diagnosed by both (Fig. 3), 25 by target biopsy, and one by systematic biopsy. The significant cancer detected by systematic biopsy alone was a GS 7 tumor.
DISCUSSION
PI-RADS 4 and 5 have a higher risk of significant cancer than PI-RADS 1–3. As a prostate cancer becomes GS 7 or higher, the tumor has stronger signal intensity on diffusion-weighted or T2-weighted MR images. Target biopsy is performed in PI-RADS 4 or 5 under MRI-TRUS fusion or in-bore MRI guidance because this category is clearly visible on MRI. In contrast, TRUS has not been concerned in targeting a prostate cancer because this modality cannot clearly depict it. Interestingly, it is not uncommon for an experienced operator to see a well-demarcated tumor on TRUS. This tumor frequently turns out to be a significant cancer. Besides, it is still unclear if PI-RADS 4 or 5 is visible on TRUS or if this category is targeted by TRUS. Our study showed that the significant CDRs of PI-RADS 4 and 5 using TRUS is not inferior to those using MRI-TRUS fusion or in-bore MRI in previously published investigations. They reported that the significant CDRs of PI-RADS 4 and 5 are 22.1% to 78.0% and 72.4% to 90.7%, respectively [4-6,8,14-16]. Our significant CDRs of these categories were 44.1% and 85.7%, respectively.
New TRUS techniques were applied in our study. One is that prostate was not compressed until a lesion was detected. If prostate is compressed, a cancer is likely to be compressed so that it cannot be seen on TRUS. A small peripheral cancer near Denonvilliers’ fascia becomes flat frequently due to prostate compression. It is difficult to differentiate the compressed hypoechoic tumor from the thick hypoechoic rectoprostatic fascia. The other is that tumor location on TRUS looked quite different from that on MRI. The axial TRUS images are obtained obliquely to urethra, whereas the axial MR images are done perpendicular to urethra. For the same reason, the tumor size or shape on TRUS also appears different from that on MRI. The difference of MRI-TRUS scan axis makes it difficult for TRUS operators to find a lesion that is categorized as PI-RADS 4 or 5 lesion on MRI.
New TRUS features of significant cancer were also applied in our study. It is generally accepted that prostate cancer is not clearly depicted on TRUS. However, peripheral cancer becomes more hypoechoic on TRUS if a GS becomes 7 or higher. Our study demonstrated that the CDR of peripheral PI-RADS 4 or 5 was 100% with target biopsy alone when the tumor was completely demarcated on TRUS. Unfortunately, the TRUS features of transition cancer are not well known. Our study assumed that transition cancer becomes hyperechoic if GS increases. Investigations reporting the TRUS features of transition cancer are extremely rare. Several studies [17-19] reported the presence of hyperechoic prostate cancers, but they did not demonstrate that these tumors are transition cancers. Some investigations have reported that transition cancer is more hyperechoic than peripheral cancer [10-13]. Our study showed that the CDR of transition PI-RADS 4 or 5 were higher than that of peripheral PI-RADS 4 or 5 using the new TRUS features of transition tumor. Further investigation is necessary to validate the TRUS feature of transition tumor because the number of transition tumor was small. Recently, ultra-high resolution TRUS probe has developed and provided a potential to image or biopsy a significant prostate cancer. Accordingly, it will be promising for improving lesion detection and sampling under the guidance [20-22]. Recently, much higher-resolution TRUS has been introduced to image and biopsy a prostate cancer. Increasing resolution may lead to increasing more precise detection or biopsy of a PI-RADS 4 or 5 lesion [20,21,23].
Systematic biopsy was frequently performed in our study even if PI-RADS 4 or 5 was all visible on TRUS. The lesion visibility was different each other. Systematic biopsy was added to target biopsy when an operator was not convinced that tumor margin was completely visible on TRUS. The overall and significant CDR had been improved approximately 10% to 20% by means of increasing the number of systematic biopsies before. Systematic biopsy yielded 13% to 25% significant CDR in the prostate other than PI-RADS 4 or 5 in our study. These CDRs are much lower than those of target biopsy in PI-RADS 4 or 5. These findings indicate that prostate cancer is frequently multifocal [24-26]. Therefore, insignificant cancer may be detected by target biopsy whereas significant cancer may be done by systematic biopsy. If target biopsy alone is performed using MRI-TRUS fusion or in-bore MRI, significant cancer will be missed in the prostate other than PI-RADS 4 or 5. Indeed, systematic biopsy is necessary in PI-RADS 4 or 5 if unilateral focal therapy is planned for management. Furthermore, systematic biopsy may provide additional value to target biopsy in case that PI-RADS 4 or 5 is mis-targeted or inflammation [27].
Our study had some limitations. First, there were no objective criteria for adding systematic biopsy to target biopsy. The lesion visibility is a key finding to determine whether or not systematic biopsy is performed. However, it relies on operator’s skill and experience. Second, the optimal protocol of systematic biopsy was not established in PI-RADS 4 or 5. Increasing number of systematic cores increases not only significant CDR, but also complication rate such as pain, urinary retention, bleeding, and infection [28-31]. Third, the optimal number of target cores was not established either. When GS 4 component is small and eccentric in PI-RADS 4 or 5, target biopsy only obtained from the tumor center may miss significant cancer. Our study sampled target cores from peripheral area as well as central area in the PI-RADS 4 or 5, subsequently resulting in increased number of target cores. Fourth, still, TRUS-guided target biopsy is not widely accepted as a biopsy technique. Fifth, the number of cases was relatively small. Last, our study design was retrospective.
In conclusion, new TRUS biopsy techniques provide a good significant CDR in patients with PI-RADS 4 and 5 if an operator is familiar with the new TRUS techniques and imaging features. However, systematic biopsy is difficult to skip because it can detect additional cancers which are missed or underscored by target biopsy. When these categories are identified on pre-biopsy MRI, TRUS should be first performed to assess lesion visibility prior to MRI-TRUS fusion or in-bore MRI-guided biopsy.
Notes
No potential conflict of interest relevant to this article was reported.
AUTHOR CONTRIBUTIONS
Conception or design: TA, BKP.
Acquisition, analysis, or interpretation of data: TA, BKP.
Drafting the work or revising: TA, BKP.
Final approval of the manuscript: TA, BKP