Signatory metabolomics biomarkers of stress, anxiety, and depression: a proof of concept for precision health among university students: A cross-sectional study
Article information

Abstract
Purpose
The highly competitive nature of tertiary education and the pressure to perform academically have increased psychological morbidity like emotional distress. Untargeted metabolomics was used to analyze serum samples of university students for biomarkers and perturbated metabolism due to stress, anxiety, and depression (SAD).
Methods
Depression, Anxiety, Stress Scale 21 (DASS-21) was used to assess the severity of SAD in university students. The metabolite fingerprint of each subject was obtained using liquid chromatography-mass spectrometry quadrupole time-of-flight (LC/MS QTOF). The signature metabolites for each trait were determined by projections to latent structures discriminant analysis (PLS-DA) with variable importance for the projection (VIP) score > 1.0 (P<0.05) and subjected to analysis using the area under the receiver operating characteristic curve (AUROC). Potential biomarkers with an area under the curve (AUC) value exceeding 0.65 were identified.
Results
Various groups of glycerophospholipids were upregulated in the studied traits. On the other hand, metabolites such as glycocholic acid was upregulated in depression, while hypoxanthine was upregulated in anxiety, and PE-Cer(d14:1(4E)/22:1(13Z)) was upregulated in stress.
Conclusion
To our knowledge, this is the first study to assess the relationship of the differentially expressed metabolites in university students of different categories of SAD using the DASS-21 screening tool in Malaysia as we move forward with precision health.
INTRODUCTION
University life has been challenging, as students are compelled to cope with various psychological adaptations besides academic demands and social standards in the ever-changing world. The increasingly competitive nature of tertiary education as well as the high expectation of academic achievement has led to psychological morbidity such as emotional distress and perturbation. According to the National Health Morbidity and Survey (NHMS) conducted in Malaysia, mental health problems had increased from 10.7% in 1996 to 29.2% in 2015. The common psychological problems among students are stress, anxiety, and depression (SAD) [1]. These could potentially bring adverse effects to different domains of students’ lives such as low quality of life, compromised physical health, negatively impacts relationships with their loved ones, hindering from discovering and acknowledging their true potential, compromised future employment and results in suicidal ideation.
One of the contributing factors to the exacerbation of students’ mental health includes increased mental distress in the youth [2], lack of individualized support [3], and even academic and personal competition between peers [4]. For some students, financial constrain is a major problem especially those of underprivileged or low-income families which ultimately might affect their academic performance [5]. Students were apprehensive which raised their stress levels [6].
Metabolic profiling in which small-molecule metabolites, the end products of genetic, transcriptional, and translational alterations are characterized, is an excellent initiative toward a more accurate and precise diagnosis. This represents a promising avenue for identifying new biomarkers that may not have been previously identified to be associated with SAD, which could aid in the early detection and prevention of such issues. A biomarker is a feature that can be measured objectively, serving as an indication of typical biological processes, pathological processes, or the effects of therapeutic interventions, according to its definition. Biomarkers are helpful in diagnosing the disorder as well as in choosing and predicting the treatment response. This is exemplified as alterations in metabolites are associated with physiological processes that are adversely impacted and reflect one’s overall health.
Several reviews have been conducted to investigate metabolic changes associated with SAD. In a study by Bot et al. [7], metabolic markers, mainly lipids, were compared between depressed and control groups in nine Dutch cohorts. The researchers found that elevated levels of apolipoprotein B, very-low-density lipoprotein cholesterol, triglycerides, diglycerides, total and monounsaturated fatty acids, fatty acid chain length, glycoprotein acetyls, tyrosine, and isoleucine were linked to an increased likelihood of experiencing depression, while reduced levels of high-density lipoprotein (HDL) cholesterol, acetate, and apolipoprotein A1 were also observed. Furthermore, assessments of lipid composition indicators showed a shift towards lower HDL and higher very-low-density lipoprotein and triglyceride particles in individuals with depression.
On the other hand, a mounting body of evidence indicates that membrane lipids and lipid oxidation are fundamental in the development of anxiety disorders [8]. Membrane lipids are vital in the signaling and barrier function of membranes [9]. Moreover, Kui et al. [10] carried out a preliminary study to explore the differences between plasma samples from patients with anxiety disorder and healthy individuals and found that the combined diagnostic factors 4-acetamidobutanoate, 3-hydroxysebacic acid, and cytosine on the pathogenesis of anxiety disorders. Given the diverse functions of lipids in brain activity, it is understandable that they play an essential role in stress and stress-related disorders [11].
A study by Chuang et al. [12], reported the combination of social stress and high-fat diet resulted in notable disturbances in lipid regulation. Specifically, it led to two prominent characteristics of metabolic syndrome: (1) heightened levels of non-HDL cholesterol in the blood and (2) the buildup of triglycerides within the liver. Moreover, these effects coincided with various alterations in the expression of genes in the liver that are associated with lipid regulation.
It is widely acknowledged that the magnitude of mental health issues such as SAD in university students tend to manifest when they have already progressed to a significant extent [6,13,14]. However, despite numerous metabolomics studies of SAD being carried out frequently, previous findings has been mainly focusing only on individuals with serious mental health issues [15-17]. While this inevitably provide insights to the existing body of knowledge, less attention has been given to said healthy individuals who might experiencing mild or early symptoms of SAD. Like any other chronic diseases which develop gradually over time, unfortunately, people who might experience SAD symptoms may not realize that their extended hours of social networking, entertainment, and internet browsing are contributing to their psychological distress. Instead they may find pleasure in this addictive self-appeal, which alternately can negatively impact their psychological wellbeing [18,19]. As a result, there is a relative lack research examining on these individuals.
In this study, we performed untargeted metabolomic profiling to determine differences in the expression of metabolites between students categorized according to Depression, Anxiety, Stress Scale 21 (DASS-21) screening tool as normal and SAD to assess their potential diagnostic biomarkers in detecting SAD. This is in line with the move to realize precision health starting from the university students.
METHODS
Ethics approval and informed consent
The local Research Ethics Committee approved the study protocol (ethics no: REC/365/16). Prior to participant recruitment, the study framework and protocol were thoroughly explained to potential participants. Each participant provided written informed consent before sampling. All procedures adhered to the principles of the Declaration of Helsinki.
Participants
Participants who were attending undergraduate courses at Universiti Teknologi MARA (UiTM), Puncak Alam, Malaysia. Most of the students in this institution are Bumiputera ethnic group. Participants were recruited through convenience sampling. The participants for this study were a subset of the participants in a previously reported study who had completed their DASS-21 questionnaire. To assess the state of SAD, all psychometric properties was also measured [20].
The inclusion criteria were as follows: (1) undergraduate students in UiTM Puncak Alam; (2) physically healthy with no known chronic or heritable diseases; (3) willing to provide blood samples; and (4) participants who are not currently experiencing menstruation. The exclusion criteria were as follows: (1) participants with heritable diseases or known chronic disease; (2) inability to cooperate and accommodate for any reason.
Questionnaire
In this study, a questionnaire with two sections was utilized. The first section obtained information regarding socio-demographic data such as gender, age, and marital status, academic-related data such as university cumulative grade point average (CGPA) and education fund, health and lifestyle habits such as smoking and alcohol consumption, and medical history including the presence of physical and mental dysfunctions.
In the second section, the DASS-21 was applied. The DASS-21 questionnaire consists of three subscales: SAD in which each comprised of seven items. Each item includes a statement and four response options indicating the level of severity, which is scored on a scale of 0 (not applicable) to 3 (highly applicable). To produce equivalent scores to the full DASS-42, the total score of each subscale is multiplied by two, resulting in a score range of 0 to 42. The subscale for stress is related to continuous arousal and tension. The anxiety items evaluate fear reaction and psychological arousal, while the depression items measure low mood, low self-esteem, and a negative perspective on the future. SAD levels were classified as “normal,” “mild,” “moderate,” “severe,” and “extremely severe.” The DASS has demonstrated excellent psychometric properties in both clinical and non-clinical populations, showing adequate validity and high internal consistency [21,22].
Serum collection
Blood samples (5 mL) from fasting participants were collected before 10:00 AM. Serum was prepared by allowing the blood to sit undisturbed to allow clot formation for 30 minutes at room temperature. After collection, the blood sample was centrifuged at 2,500×g for 15 minutes at 4 °C. The resulting aliquots were transferred to 1.5 mL microcentrifuge tubes and promptly stored at –80 °C.
Serum preparation
A 150 μL of distilled water (dH2O, pH10) was added to 150 μL of aliquots of serum. Next, 300 μL of cold acetonitrile (Merck) was added to precipitate proteins, followed by 2 minutes of vortex mixing. After centrifuging at 10,000×g for 10 minutes using a centrifuge 5804R (Eppendorf), the supernatant was transferred to a new microcentrifuge tube. This process was repeated twice, and the supernatant was concentrated using a concentrator plus (Eppendorf). The sample was reconstituted with 30 μL of mobile phase (95H2O: 5ACN) and vortexed for 2 minutes before centrifuging at 10,000×g for 10 minutes. Subsequently, 20 μL of supernatant was transferred to an autosampler vial insert, which was then injected into the liquid chromatography-mass spectrometry (LC/MS)-quadrupole time-of-flight (QTOF) system for analysis.
Liquid chromatography-mass spectrometry
LC/MS-QTOF was used to obtain the metabolite fingerprint of each serum sample. Chromatographic analysis was carried out using an Agilent LC 1200 Series system controlled by Agilent Mass Hunter Workstation Acquisition (B.02.01). The separation was performed using a ZORBAX Eclipse Plus C18 column (2.1 mm×100 mm, 1.8 μm; Agilent Technologies) with a gradient of (A) 0.1% formic acid in water and (B) 0.1% formic acid in acetonitrile, over 0 to 48 minutes with increasing B percentage from 5% to 95% at 40 °C. The flow rate was 0.25 mL/min, and the injection volume was 2 μL. The mass spectrometry was operated in electrospray ionization positive mode of accurate mass–QTOF (Agilent Technologies 6520). The drying gas temperature, drying gas flow, nebulizer pressure, and fragmentor voltage were set at 300 °C, 3.0 L/min, 15 psi, and 175 V, respectively. The analysis was performed in triplicate. Quality control (QC) samples were prepared from the aliquot of nine batches of pooled samples, and they were injected independently at the beginning, middle, and end of the run to assess the system stability, performance, and consistency of sample preparation for each analysis batch. The QC samples were evaluated by analyzing the relative standard deviation of selected metabolites (Supplementary Table 1).
Data processing and statistical analysis
The statistical analysis of the DASS-21 questionnaire data was conducted using SPSS software version 26.0 (IBM Corporation). Mean and standard deviation were used to report continuous data, while frequencies and percentages were used for categorical data [20]. The raw data from mass spectrometry (.d files) were processed with Agilent Mass Hunter Qualitative B.05.00 software (Agilent Technologies). Subsequently, data filtering was performed using mass profiler professional (MPP) version B.12.01 (Agilent Technologies). Samples from participants were categorized into two traits: (1) with normal DASS-21 scores as the control group and (2) with DASS-21 scores which were out of normal range (labelled as non-normal). The compounds identified from the samples were characterized and annotated using the METLIN database and Human Metabolome Database (HMDB). The obtained data was subsequently imported into Metaboanalyst 5.0 for multivariate analysis. To differentiate between the metabolic profiles of normal and non-normal groups, principal component analysis (PCA) was performed. To demonstrate the differences in metabolic profiles of the two groups, the partial least squares method (projections to latent structures discriminant analysis [PLS-DA]) analysis was used. Additionally, the variable importance for the projection (VIP) index was used to assess the intensity and explanatory ability of the metabolite expression pattern for the classification and discrimination of each sample group. The metabolites for each trait were subjected to area under receiver operating characteristic curve (AUROC) to identify potential biomarkers with an area under the curve (AUC) value exceeding 0.65. These metabolites were subjected to metabolomics pathway analysis to determine perturbated pathways associated with normal and non-normal SAD.
Prediction of metabotypes
Prediction of metabotypes (normal and non-normal) among the participants was carried out using conditional logistic regression. A model was constructed based on the eight metabolites with the highest AUC values to accurately predict the phenotype of the participants according to their profiled metabolites and identified biomarkers.
RESULTS
Participants demographics
This study involved a total of 38 female participants, aged between 21 and 25 years, with a mean age of 22.8±1.2 years old, and from the 3rd and 4th year of study. The participants had a mean CGPA of 3.23±0.23 and the majority were Malays (92.1%) and single. Over half of the participants reported receiving scholarships during their studies, while monthly family income varied widely among participants. Table 1 presents a summary of the participants’ demographics and relevant characteristics.

Demographic characteristics of the studied participants (n=38)
Assessment of stress, anxiety, and stress severity
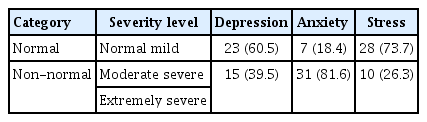
The distribution of normal versus non-normal groups of the SAD in which traits such as normal and mild were categorized under the normal group while traits such as moderate, severe, and extremely severe were categorized non-normal groups (Table 2). A total of 23 students were grouped as normal and 15 students were grouped as non-normal in depression. Next, seven students were categorized as normal while the rest were grouped as anxiety group. Also, 28 students were grouped as normal for stress and 10 students were categorized as stressed. Our analysis revealed significant correlations among anxiety, depression, and stress. Specifically, we found that anxiety was positively correlated with depression (r=0.533, P=0.000), depression was positively correlated with stress (r=0.665, P=0.000), and anxiety was positively correlated with stress (r=0.637, P=0.000). However, we did not find any significant correlation between CGPA and SAD. On the other hand, only stress showed significant correlation with education fund (r=–0.419, P=0.008) and family income (P=–0.406, P=0.010).
Severity levels of stress, anxiety, and depression among participants according to gender
Metabolites identification
Metlin database and HMDB was used to identified and characterized all the metabolites. The details of the expressed metabolites across different traits is presented in Supplementary Table 2.
Metabolic profiles of different groups
We performed both unsupervised multivariate analysis (PCA) (Supplementary Table 1) and supervised multivariate analysis (PLS-DA) (Fig. 1). While the PCA plot showed no significant separation of groups in all groups (Supplementary Fig. 1, stress vs. normal; Supplementary Fig. 2, anxiety vs. normal; Supplementary Fig. 3, depression vs. normal). On the other hand, the PLS-DA score plot (Fig. 1) for SAD shows clear discrimination. The analysis using PLS-DA score plot revealed eight metabolites that differed significantly (P<0.05, VIP >1) between the anxiety and normal groups. Among these metabolites were glycerophospholipids, one bile acid metabolite, and one purine metabolite which were upregulated in the anxiety group. Similarly, the variable importance in projection scores for glycerophospholipids and bile acid metabolites were upregulated in the depressed group (P<0.05, VIP >1). Furthermore, PLS-DA score plot analysis showed that glycerophospholipids, bile acid, and purine metabolites were upregulated in the stressed group, with significant differences (P<0.05, VIP >1) when compared to the normal group.
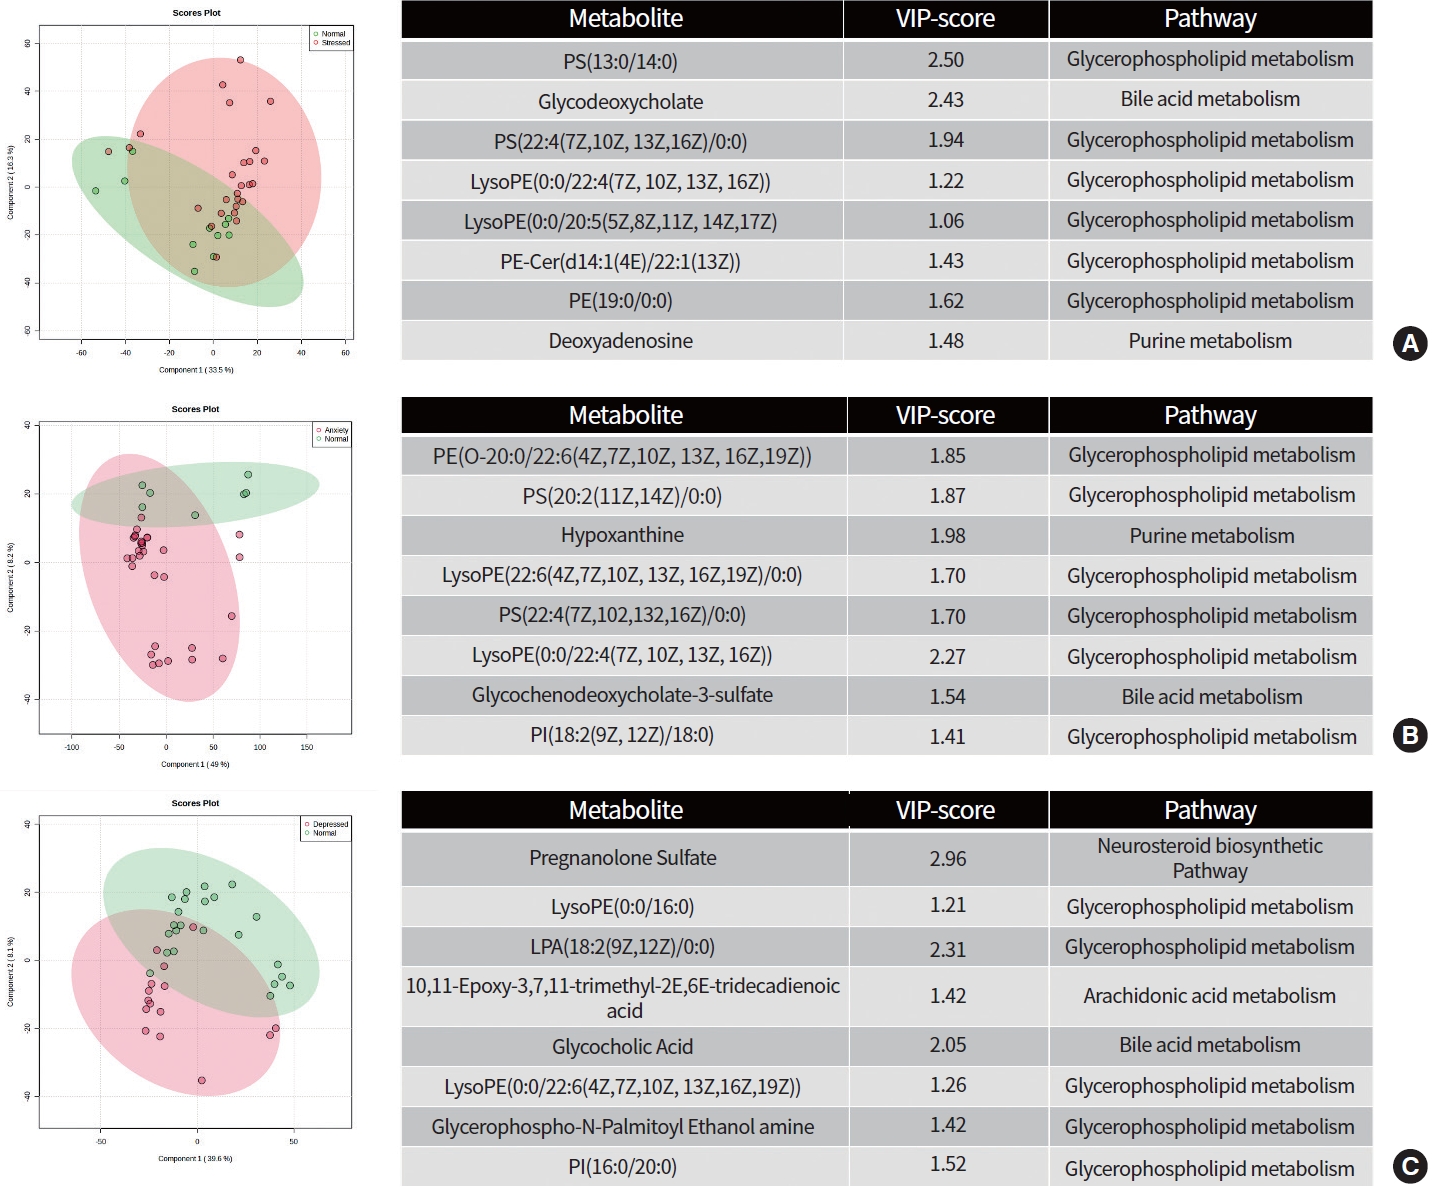
Projections to latent structures discriminant analysis (PLS-DA) score plot differentiating participants with (A) stress, (B) anxiety, and (C) depression against normal group along with the variable importance in projection (VIP) score of identified metabolites and its associated metabolic pathways between groups.
Biomarkers identification
To assess the diagnostic performance of the metabolites that were found to be differentially expressed across all groups, we conducted ROC analysis. Table 3 presents the differential metabolites that had an AUC area greater than 0.65.
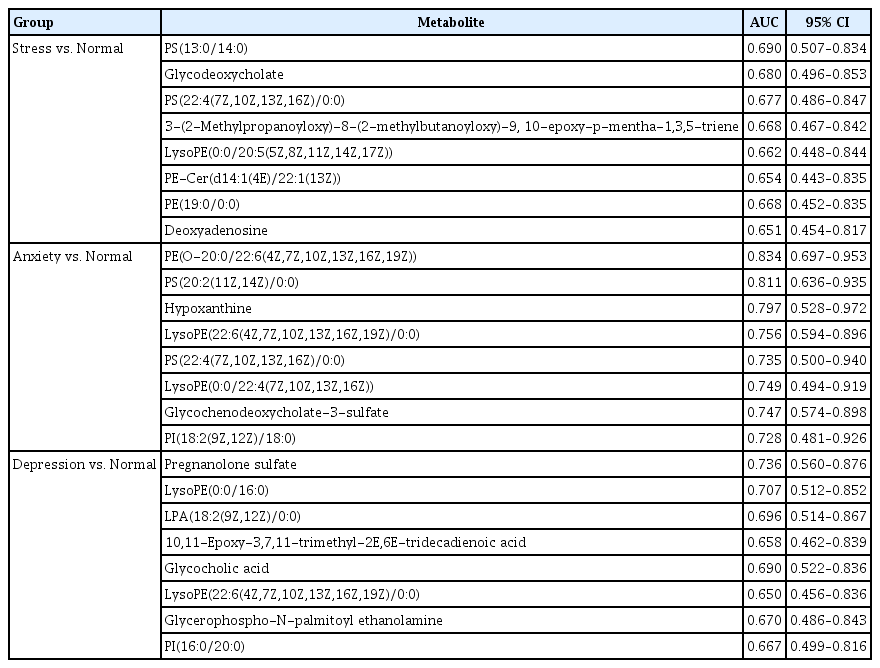
The AUC values above 0.65 is considered a putative biomarkers to differentiate between groups
The AUC scores for the metabolites differentiated in participants with depressed and normal groups were calculated. The AUC of pregnanolone sulfate was 0.736 (95% confidence interval [CI], 0.56 to 0.876). In addition, the AUC of LysoPE(0:0/16:0) was 0.707 (95% CI, 0.512 to 0.852), LPA(18:2(9Z,12Z)/0:0) was 0.696 (95% CI, 0.514 to 0.867), 10,11-epoxy-3,7,11-trimethyl-2E,6E-tridecadienoic acid was 0.658 (95% CI, 0.462 to 0.839), glycocholic acid was 0.69 (95% CI, 0.522 to 0.836), LysoPE(22:6(4Z,7Z,10Z,13Z,16Z,19Z)/0:0) was 0.65 (95% CI, 0.456 to 0.836), glycerophospho-N-palmitoyl ethanolamine was 0.67 (95% CI, 0.486 to 0.843) and PI(16:0/20:0) was 0.667 (95% CI, 0.499 to 0.816).
In anxiety versus normal group, the AUC of PE(O-20:0/22:6(4Z,7Z,10Z,13Z,16Z,19Z)) was 0.834 (95% CI, 0.697 to 0.953), PS(20:2(11Z,14Z)/0:0) was 0.811 (95% CI, 0.636 to 0.935), hypoxanthine was 0.797 (95% CI, 0.528 to 0.972), LysoPE(22:6(4Z,7Z,10Z,13Z,16Z,19Z)/0:0) was 0.756 (95% CI, 0.594 to 0.896), PS(22:4(7Z,10Z,13Z,16Z)/0:0) was 0.735 (95% CI, 0.5 to 0.94), LysoPE(0:0/22:4(7Z,10Z,13Z,16Z)) was 0.749 (95% CI, 0.494 to 0.919), glycochenodeoxycholate-3-sulfate was 0.747 (95% CI, 0.574 to 0.898) and PI(18:2(9Z,12Z)/18:0) was 0.728 (95% CI, 0.481 to 0.926).
Similarly, the AUC of stress versus normal group was 0.69 (95% CI, 0.507 to 0.834) for PS(13:0/14:0). In addition, the AUC of glycodeoxycholate was 0.68 (95% CI, 0.496 to 0.853), PS(22:4(7Z,10Z,13Z,16Z)/0:0) was 0.677 (95% CI, 0.486 to 0.847), 3-(2-methylpropanoyloxy)-8-(2-methylbutanoyloxy)-9,10-epoxy-p-mentha-1,3,5-triene was 0.668 (95% CI, 0.467 to 0.842), LysoPE(0:0/20:5(5Z,8Z,11Z,14Z,17Z)) was 0.662 (95% CI, 0.448 to 0.844), PE-Cer(d14:1(4E)/22:1(13Z)) was 0.654 (95% CI, 0.443 to 0.835), PE(19:0/0:0) was 0.668 (95% CI, 0.452 to 0.835) and deoxyadenosine was 0.651 (95% CI, 0.454 to 0.817).
Metabotypes prediction of the participants
In order to investigate potential biomarkers associated with SAD, a conditional logistic stepwise regression analysis was conducted utilizing the eight lipids with the highest AUC scores. The findings revealed that PE-Cer(d14:1(4E)/22:1(13Z)) (P=0.013) was significantly linked to stress, hypoxanthine (P=0.011) was significantly linked to anxiety, and glycocholic acid was significantly linked to depression (P=0.037).
We conducted an exploratory multiple regression analysis using the complete model to examine if the demographic characteristics of the students influence the metabolites listed in Table 4. Nevertheless, the results indicated no significant differences (Supplementary Table 1).

Logistic regression for the selection of potential biomarker for stress, anxiety, and depression
DISCUSSION
To our knowledge, our study is the initial attempt to examine the connection between the SAD based on DASS-21 screening tool and the serum metabolic profiles of the university students. The pathophysiology as well as clinical stages of SAD have been thoroughly explored and investigated previously due to its prospective potential of morbidity and mortality [23]. SAD are known to result in low quality of life as well as multiple adverse health effects [24]. In this study, anxiety was reported to be the most prevailing with a staggering 92.7%, followed by stress with 68.3%, and depression with 53.7%. Although the DASS-21 questionnaire is not a diagnostic tool, the rates of moderate to extremely severe in symptoms of SAD highlights the need for attention from health care professionals and university administrative personnel. This lends credence to our hypothesis that SAD are common among the university students [20,25].
In this study, we found that stress has a greater impact to students who are self-funded and those coming from low-income families. Although, education fund and family income have no significant correlation with CGPA in this study, it has been reported previously [26] that financially struggling students are more likely to fall into anxiety and depression plus more likely to have lower grades and drop out.
Oxidative stress (OS) occurs when there is an imbalance between the production of reactive oxygen species (ROS) resulting from aerobic metabolism in mitochondria and the body’s antioxidant defense mechanisms that act against them [27]. The brain is particularly vulnerable to OS or redox imbalances due to its high oxygen consumption and lipid-rich environment. Recently, it was suggested that OS may contribute to stress or mental disorders due to reduced neurogenesis or neuroplasticity which significantly can cause brain damage [28]. As a result, it is not surprising that OS has been implicated in a variety of mental disorders such as depression [29-31], anxiety disorders [32], schizophrenia [33], and bipolar disorder [34]. Blood metabolites concentrations have been explored extensively as a proxy of biomarkers for different mental illnesses such as major depressive disorder (MDD) [35-37], anxiety disorders [37], antenatal depression [38], postpartum depression [39], schizophrenia [15]. These studies corroborate and suggest that peripheral metabolites biomarkers can be determined and monitored readily to evaluate the effects of OS in the brain.
Over the last few years, lipid metabolites are increasingly being acknowledged and have shed more light in psychiatric research due to its potential in investigating lipid perturbations in different subtypes of mental illnesses, such as in depression and anxiety [37], MDD [35], antenatal depression [38]. A review by Muller et al. [40] (2015) reported that global lipid perturbations in MDD and anxiety disorders compromises membrane function as a barrier and a signaling medium for classical transmitter signaling.
The brain, being a lipid-rich organ, requires a substantial amount of lipids, as they play a crucial role in the formation of lengthy neuron expansions and the essential myelin sheaths [27]. The lipid components of mammalian membranes consist of glycerophospholipids, sphingolipids, and the sterol lipid cholesterol. Glycerophospholipids are primarily involved in membrane formation and trafficking. As lipids are hierarchically organized and highly interrelated, any changes at these levels could have a significant impact on the overall lipidome of depression and anxiety. Phosphatidylcholines (PC), phosphatidylethanolamines (PE), phosphatidylserines (PS), and phosphatidylinositols (PI) are the typical glycerophospholipids found in mammalian membranes, all attached through a phosphodiester linkage [40].
From our study, we found that the levels of lysophosphatidylethanolamine (LPE), PC, PE, PI, phosphatidic acid (PA) and PS were higher in participants who were stressed, anxious, and depressed. Moreover, ROC analysis based on AUC values revealed a distinctive diagnostic value for all these metabolites (AUC value of more than 0.65). Consistent with our findings, several studies [35,38,40] had reported regarding the total levels of the following lipid classes (LPE, PC, PE, PS, PA, and PI) were elevated in anxious and depressed individuals. LPE are predominantly produced by phospholipase A2 (PLA2) and are also highly active molecules. OS, which increases PLA2 hepatic activity and PC hepatic hydrolysis to raise the plasma concentrations of polyunsaturated LPE, is a hallmark of depression [41]. PLA2 can have diverse regulatory effects and may also disrupt cell membranes. Therefore, while PLA2 activation is involved in signal transduction, the resulting products cannot persist to prevent interference with neuronal functions. As a result, the effects of PLA2 activation need to be promptly reversed. In patients with severe depression and bipolar disorder, there was a significantly higher level of PLA2 activity than in healthy controls [40]. Because PLA2 is part of an inflammation, oxidative and nitrosative stress pathway, these processes could be important in the pathophysiology of depression.
It is noteworthy that the anxiety group exhibited an increase in hypoxanthine. In the purine metabolic pathway, hypoxanthine is converted into xanthine and uric acid by xanthine oxidase, which generates ROS. Moderate levels of ROS have been shown to impair various physiological functions. If ROS concentrations surpass an organism’s antioxidant capacity, cells undergo OS, leading to oxidative damage to cellular components. As a result, OS has been linked to several diseases, including cancer, diabetes, autoimmune diseases, male infertility, atherosclerosis, and cardiovascular disease. A study by Bouayed et al. [32] found that mice with high anxiety had significantly higher levels of intracellular ROS in lymphocytes, granulocytes, and monocytes. This suggests a correlation between the level of intracellular ROS in peripheral blood cells and anxiety-related behavior.
Glycocholic acid is a bile acid-glycine conjugate and an acyl glycine. It is classified as a secondary bile acid that is produced through enzymatic action by microorganisms in the colon. Its primary function is to aid in the emulsification of fats, and it is crucial for cholesterol and lipid absorption, energy regulation, and glucose homeostasis. Despite its important role, it can also be toxic and cause membrane disruption. Recent research by Zhao et al. [42] revealed that fecal metabolomics in depressed mice showed changes in bile acid metabolism. Previous studies have also reported alterations in bile acid metabolites such as cholic acid, deoxycholic acid, and chenodeoxycholic acid in individuals with depression using fecal metabolomics.
In a study conducted by Hwa Yun et al. [43] in 2020, it was discovered that deoxyadenosine could be generated via modification reactions induced by ROS. Modified lipids can react with DNA directly or through bifunctional intermediates, leading to the formation of mutagenic etheno-DNA adducts. Furthermore, deoxyadenosine has been identified as a cancer biomarker, and it plays a crucial role in initiating hepatocarcinogenesis. This biomarker has been detected in patients with nonalcoholic steatohepatitis and alcoholic liver disease. Some limitations need to be addressed. First, relatively small sample size in this study; future studies with large-scale samples are still needed to validate our findings. Next, serum cortisol and cortisone could potentially be a useful biomarker to accurately validate the onset of SAD besides the differential metabolite profiles between each group. Therefore, these findings shed new lights on the molecular mechanism of SAD. And our preliminary investigation found that studies on potential biomarkers such as lipid classes (LPE, PC, PE, PS, PA, and PI) and hypoxanthine in OS and SAD are needed for further validation.
CONCLUSION
Students with self-reported symptoms of SAD presented a significantly different expression profiles of serum metabolites compared to students who did not experience any emotional disturbances. Metabolites such as glycerophospholipids which was reported in all the studied traits can potentially be a prediction biomarker for the onset of SAD.
Supplementary materials
Quality control-relative standard deviation
List of identified metabolites
Unsupervised principal component analysis (PCA) plot of metabolite profiles from serum samples. The PCA was performed on normalized peak areas of metabolites across 38 samples between the stressed and normal groups.
Unsupervised principal component analysis (PCA) plot of metabolite profiles from serum samples. The PCA was performed on normalized peak areas of metabolites across 38 samples between the anxiety and normal groups.
Unsupervised principal component analysis (PCA) plot of metabolite profiles from serum samples. The PCA was performed on normalized peak areas of metabolites across 38 samples between the depressed and normal groups.
Acknowledgements
This project is funded by the Ministry of Higher Education Malaysia under FRGS (600- IRMI/FRGS 5/3 (455/2019)). We would like to thank undergraduate students of Faculty of Health Sciences, UiTM Puncak Alam for participating in the Zero Stress Project.
Notes
No potential conflict of interest relevant to this article was reported.
AUTHOR CONTRIBUTIONS
Conception or design: TLK, MZS.
Acquisition, analysis, or interpretation of data: RA, MNFN, MSR, RJJ, NMN, MM, TSH, PSAS, RMJ, SHAB.
Drafting the work or revising: NIUZ.
Final approval of the manuscript: NIUZ, TLK, RA, MNFN, MSR, RJJ, NMN, MM, TSH, PSAS, RMJ, SHAB, MZS.